OpenCASCADE Color Scale
eryar@163.com
Abstract. The color scale is a specialized label object that displays a color map and an accompanying numerical scale for color mapped or contour data plots. As the geometry modeling kernel of SALOME, OpenCASCADE provides the color scale function. The paper focus on the usage of color scale in OpenCASCADE.
Key Words. OpenCASCADE, Color Scale, 應力云圖, 顏色映射表
1. Introduction
應力云圖是一種應用廣泛的標量場可視化方法,也經常用于表達矢量場或張量場的一個分量。云圖在顏色與標量數據之間建立某種確定的映射關系,在計算機屏幕上繪制一個顏色離散變化的圖像來顯示科學計算結果。云圖將標量場定義域內的數據值映射成不同的顏色,從而通過顏色變化來反映數據場中數據的變化規律。
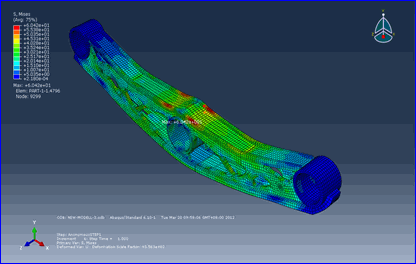
很多數值分析軟件后處理的結果都有繪制云圖的功能。如下圖所示為Abaqus軟件產生的云圖:

Figure 1.1 A Colored Stress Patterns by Abaqus
OpenCASCADE作為SALOME開源數值分析軟件的幾何造型內核,也提供了云圖可視化的功能。本文主要介紹如何使用OpenCASCADE來顯示模型的應力云圖中的顏色映射表(Color Scale)。
2. Color Scale
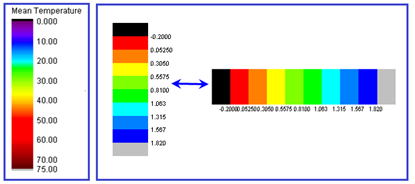
云圖繪制依賴于顏色集合與標量場數值集合之間的一一映射,即顏色映射表(Color Scale)。顏色映射表為區域填充時建立數值與顏色的映射關系。如下圖所示:

Figure 2.1 Color Scale
作為分析對比參照標準,用戶可以根據顏色線性表對應的數值范圍,來判斷某區域內數值分布規律。顏色線性表不僅應用于云圖繪制,也應用于其他計算可視化算法中。
顏色線性表可以定義成不同的形式,多以對比鮮明的色彩作為線性表段顏色,在兩個對比色之間采用過渡顏色。
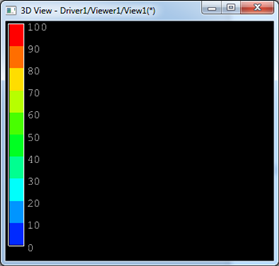
在OpenCASCADE中顏色映射表的繪制是由Viewer來實現的。其Tcl命令為vcolorscale,如下所示:

Figure 2.2 Color Scale Tcl Command: vcolorscale
默認的顏色映射表的顯示效果如下圖所示:

Figure 2.3 Color Scale in Draw Test Harness
3. Tcl Test
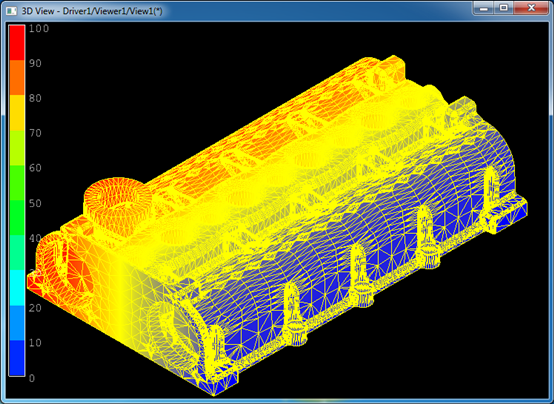
OpenCASCADE基于Tcl/Tk的Draw Test Harness環境很方便測試一些想法。現在在Draw Test Harness中來顯示一個完整的云圖,如下圖所示:

Figure 3.1 Color Scale in Draw Test Harness
實現上圖的Tcl腳本代碼如下所示:
#
# Copyright (c) 2014 eryar All Rights Reserved.
#
# File : colorscale.tcl
# Author : eryar@163.com
# Date : 2014-09-20 18:10
# Version : 1.0v
#
# Description : Demonstrate the usage of OpenCASCADE color scale.
#
pload ALL
meshfromstl m data/stl/head.stl
meshcolors m nodaltex 0
# show the color sacle.
vcolorscale
vfit
首先加載所需要的所有模塊,再從head.stl中加載網格模型;設置網格頂點顏色后就用vcolorscale命令打開發顏色映射表。
4.Code Analysis
根據Tcl命令找到對應的C++實現代碼如下所示:
//=============================================================================
//function : VColorScale
//purpose : representation color scale
//=============================================================================
#include <V3d_ColorScale.hxx>
static int VColorScale (Draw_Interpretor& di, Standard_Integer argc, const char ** argv)
{
if ( argc != 1 && argc != 4 && argc != 5 && argc != 6 && argc != 8 )
{
di << "Usage : " << argv[0] << " [RangeMin = 0 RangeMax = 100 Intervals = 10 HeightFont = 16 Position = Right X = 0 Y = 0] " << "\n";
return 1;
}
Handle(AIS_InteractiveContext) aContext = ViewerTest::GetAISContext();
if(aContext.IsNull()) {
di << argv[0] << " ERROR : use 'vinit' command before " << "\n";
return -1;
}
Standard_Real minRange = 0. , maxRange = 100. ;
Standard_Integer numIntervals = 10 ;
Standard_Integer textHeight = 16;
Aspect_TypeOfColorScalePosition position = Aspect_TOCSP_RIGHT;
Standard_Real X = 0., Y = 0. ;
if ( argc < 9 )
{
if( argc > 3 )
{
minRange = Draw::Atof( argv[1] );
maxRange = Draw::Atof( argv[2] );
numIntervals = Draw::Atoi( argv[3] );
}
if ( argc > 4 )
textHeight = Draw::Atoi( argv[4] );
if ( argc > 5 )
position = (Aspect_TypeOfColorScalePosition)Draw::Atoi( argv[5] );
if ( argc > 7 )
{
X = Draw::Atof( argv[6] );
Y = Draw::Atof( argv[7] );
}
}
Handle(V3d_View) curView = ViewerTest::CurrentView( );
if ( curView.IsNull( ) )
return 1;
Handle(Aspect_ColorScale) aCSV = curView->ColorScale( );
Handle(V3d_ColorScale) aCS = ( Handle( V3d_ColorScale )::DownCast( aCSV ) );
if( ! aCS.IsNull( ) )
{
aCS->SetPosition( X , Y );
aCS->SetHeight( 0.95) ;
aCS->SetTextHeight( textHeight );
aCS->SetRange( minRange , maxRange );
aCS->SetNumberOfIntervals( numIntervals );
aCS->SetLabelPosition( position );
if( !curView->ColorScaleIsDisplayed() )
curView->ColorScaleDisplay( );
}
return 0;
}
由上述代碼可知,顏色映射表主要是設置當前View中的Aspect_ColorScale。顯示顏色映射表主要是由類V3d_ColorScale實現。取得當前視圖的顏色表對象后,設置相關參數,即可調用視圖的ColorScaleDisplay()來顯示了。
根據上述Draw Test Harness中的實現代碼,可以很容易地在自己的程序中實現相關的功能了。
5.Conclusion
OpenCASCADE的視圖也提供了顯示顏色映射表的功能,通過設置視圖的V3d_ColorScale的相關參數,即可顯示出顏色映射表了。
6. References
1. 王成恩. 面向科學計算的網格劃分與可視化技術. 科學出版社. 2011