Visulalize Voronoi in OpenSceneGraph
eryar@163.com
Abstract. In mathematics a Voronoi diagram is a way of dividing space into a number of regions. A set of points, called seeds, sites, or generators is specified beforehand and for each seed there will be a correspoinding region consisting of all points closer to that seed than to any other. The regions are called Voronoi cells. It is dual to the Delaunay triangulation. It is named after Georgy Voronoy, and is also called a Voronoi tessellation, a Voronoi decomposition, a Voronoi partition, or a Dirichlet tessellation. Voronoi diagrams can be found in a large number of fields in science and technology, even in art, and they have found numerous practical and theoretical applications. The paper use OpenSceneGraph to visualize the Voronoi diagram.
Key words. Voronoi, C++, OpenSceneGraph, Visualization
1. Introduction
計算幾何(Computational Geometry)作為一門學科,起源于20世紀70年代���,經過近四十多年的發展,其研究內容不斷擴大,涉及Voronoi圖、三角剖分�����、凸包����、直線與多邊形求交、可見性、路徑規劃���、多邊形剖分等內容。據相關統計,在數以千計的相關文章中,約有15%是關于Voronoi圖及其對偶(dual)圖Delaunay三角剖分(Delaunay Triangulation)的研究�。由于Voronoi圖具有最近性�����、鄰接性等眾多性質和比較系統的理論體系��,如今已經在計算機圖形學�����、機械工程、地理信息系統�、機器人��、圖像處理、大數據分析與處理�、生物計算及無線傳感網絡等領域得到了廣泛應用���,同時也是解決碰撞檢測�����、路徑規劃、可見性計算���、骨架計算以及凸包計算等計算幾何所涉及的其他問題的有效工具�����。
Voronoi圖的起源最早可以追溯到17世紀。1644年,Descartes用類似Voronoi圖的結構顯示太陽系中物質的分布�����。數學家G.L. Dirichlet和M.G.Voronoi分別于1850年和1908年在他們的論文中討論了Voronoi圖的概念�,所以Voronoi圖又叫Dirichlet tessellation。在其他領域,這個概念也曾獨立地出現,如生物學和生理學中稱之為中軸變換(Medial Axis Transform)或骨架(Skeleton)�����?����;瘜W與物理學中稱之為Wigner-Seitz Zones,氣象學與地理學中稱之為Thiessen多邊形�����。Voronoi圖最早由Thiessen應用于氣象觀測站中隨機分布的研究���。由于M.G. Voronoi從更通用的n維情況對其進行研究和定義�����,所以Voronoi圖這個名稱為大多數人所使用���。
在路徑規劃���、機械加工���、模式識別��、虛擬現實、生物計算等領域�����,將站點從離散點擴展到線段圓弧等生成Voronoi圖的方式也是非常常見的�。
目前可用于生成Voronoi圖的庫有一些,很多是開源庫���。像CGAL庫���、boost中也提供了生成Voronoi圖的算法���。本文根據Shane O Sullivans1封裝的Voronoi庫�,并用OpenSceneGraph顯示出剖分結果。
2. Implementation
用Shane O Sullivans封裝的VoronoiDiagramGenerator可以生成點集的Voronoi圖,得到剖分的線段。程序小巧�����,易于使用���。結合OpenSceneGraph將剖分得到的線段顯示出來�。程序代碼如下所示:
/*
* Copyright (c) 2014 eryar All Rights Reserved.
*
* File : Main.cpp
* Author : eryar@163.com
* Date : 2014-04-30 18:28
* Version : V1.0
*
* Description : VoronoiViewer for voronoi library visulization.
*
*/
#include "VoronoiDiagramGenerator.h"
// OpenSceneGraph library.
#include <osgDB/ReadFile>
#include <osgViewer/Viewer>
#include <osgGA/StateSetManipulator>
#include <osgViewer/ViewerEventHandlers>
#pragma comment(lib, "osgd.lib")
#pragma comment(lib, "osgDBd.lib")
#pragma comment(lib, "osgGAd.lib")
#pragma comment(lib, "osgViewerd.lib")
osg::Node* BuildVoronoi(void)
{
osg::ref_ptr<osg::Geode> theGeode = new osg::Geode();
osg::ref_ptr<osg::Geometry> theLines = new osg::Geometry();
osg::ref_ptr<osg::Vec3Array> theVertices = new osg::Vec3Array();
const long thePointCount = 10;
float *xValues = new float[thePointCount] ();
float *yValues = new float[thePointCount] ();
float theMin = 0.0;
float theMax = 100.0;
float x1 = 0.0;
float y1 = 0.0;
float x2 = 0.0;
float y2 = 0.0;
// Draw the boundary box.
theVertices->push_back(osg::Vec3(theMin, 0.0, theMin));
theVertices->push_back(osg::Vec3(theMin, 0.0, theMax));
theVertices->push_back(osg::Vec3(theMin, 0.0, theMin));
theVertices->push_back(osg::Vec3(theMax, 0.0, theMin));
theVertices->push_back(osg::Vec3(theMin, 0.0, theMax));
theVertices->push_back(osg::Vec3(theMax, 0.0, theMax));
theVertices->push_back(osg::Vec3(theMax, 0.0, theMin));
theVertices->push_back(osg::Vec3(theMax, 0.0, theMax));
// initialize random seed:
srand(time(NULL));
// Sites of the Voronoi.
for (int i = 0; i < thePointCount; ++i)
{
xValues[i] = rand() % 100;
yValues[i] = rand() % 100;
// Draw the site.
theVertices->push_back(osg::Vec3(xValues[i] - 1.0, 0.0, yValues[i]));
theVertices->push_back(osg::Vec3(xValues[i] + 1.0, 0.0, yValues[i]));
theVertices->push_back(osg::Vec3(xValues[i], 0.0, yValues[i] - 1.0));
theVertices->push_back(osg::Vec3(xValues[i], 0.0, yValues[i] + 1.0));
}
// Generate Voronoi Diagram.
VoronoiDiagramGenerator vdg;
vdg.generateVoronoi(xValues, yValues, thePointCount, theMin, theMax, theMin, theMax);
vdg.resetIterator();
while (vdg.getNext(x1, y1, x2, y2))
{
theVertices->push_back(osg::Vec3(x1, 0.0, y1));
theVertices->push_back(osg::Vec3(x2, 0.0, y2));
}
theLines->setVertexArray(theVertices);
// Set the colors.
osg::ref_ptr<osg::Vec4Array> theColors = new osg::Vec4Array();
theColors->push_back(osg::Vec4(1.0f, 1.0f, 0.0f, 1.0f));
theLines->setColorArray(theColors);
theLines->setColorBinding(osg::Geometry::BIND_OVERALL);
// Set the normal.
osg::ref_ptr<osg::Vec3Array> theNormals = new osg::Vec3Array();
theNormals->push_back(osg::Vec3(0.0f, -1.0f, 0.0f));
theLines->setNormalArray(theNormals);
theLines->setNormalBinding(osg::Geometry::BIND_OVERALL);
theLines->addPrimitiveSet(new osg::DrawArrays(osg::PrimitiveSet::LINES, 0, theVertices->size()));
theGeode->addDrawable(theLines);
// Free the meomry.
delete [] xValues;
delete [] yValues;
return theGeode.release();
}
int main(int argc, char* argv[])
{
osgViewer::Viewer myViewer;
myViewer.setSceneData(BuildVoronoi());
myViewer.addEventHandler(new osgGA::StateSetManipulator(myViewer.getCamera()->getOrCreateStateSet()));
myViewer.addEventHandler(new osgViewer::StatsHandler);
myViewer.addEventHandler(new osgViewer::WindowSizeHandler);
return myViewer.run();
}
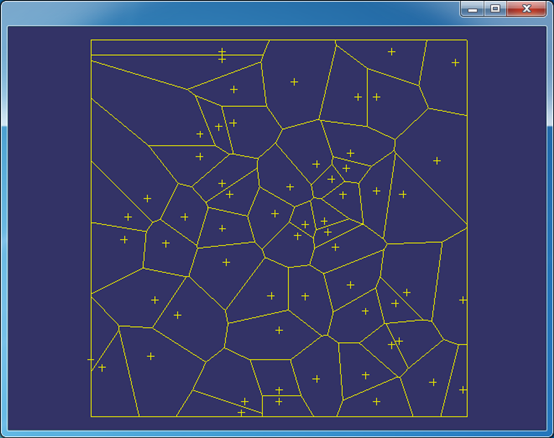
上述程序生成結果如下所示:

Figure 2.1 Voronoi Diagram in OpenSceneGraph
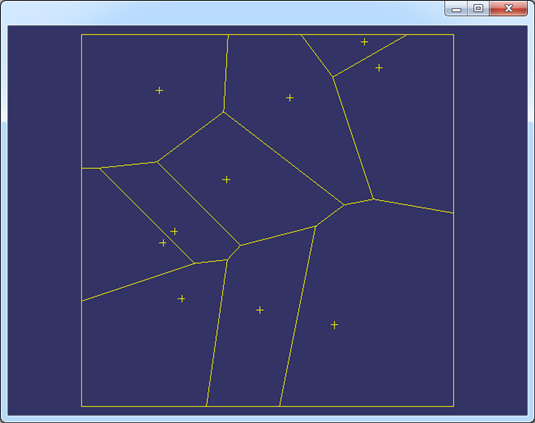
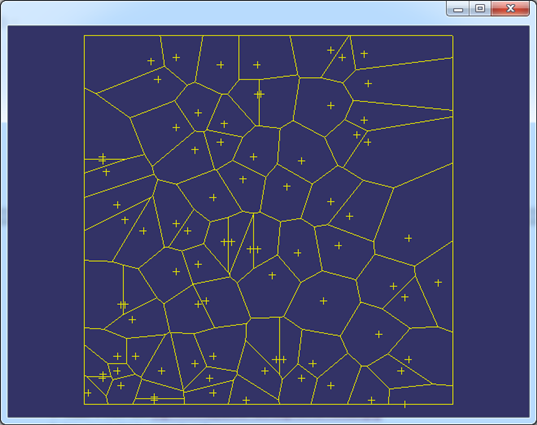
修改站點的數量,生成的Voronoi圖如下所示:
修改范圍時也要修改生成范圍中點的隨機函數的取余操作,避免生成點超出范圍��。

Figure 2.2 Less Sites of the Voronoi Diagram

Figure 2.3 More Sites of the Voronoi Diagram
3. Conclusion
Shane O Sullivans封裝的庫小巧����,使用方便,速度還很快����。也有些不足���,如不能取得一個站點對應的多邊形�,即某個點屬于哪個區域���。不能得到帶權點集的Voronoi剖分。
源程序小巧��,借助程序代碼來對Voronoi的概念進行理解還是不錯的����。
4. References
1. Shane O Sullivans, http://www.skynet.ie/~sos/mapviewer/voronoi.php
2. http://ect.bell-labs.com/who/sjf/
3. 汪嘉業, 王文平, 屠長河, 楊承磊. 計算幾何及應用. 科學出版社. 2011
4. 楊承磊, 呂琳, 楊義軍, 孟祥旭. Voronoi圖及其應用. 清華大學出版社. 2013