XCode的一些調試技巧
羅朝輝 (http://www.shnenglu.com/kesalin/)
CC 許可,轉載請注明出處
XCode 內置GDB,我們可以在命令行中使用 GDB 命令來調試我們的程序。下面將介紹一些常用的命令以及調試技巧。
po 命令:為 print object 的縮寫,顯示對象的文本描述(顯示從對象的 description 消息獲得的字符串信息)。
比如:
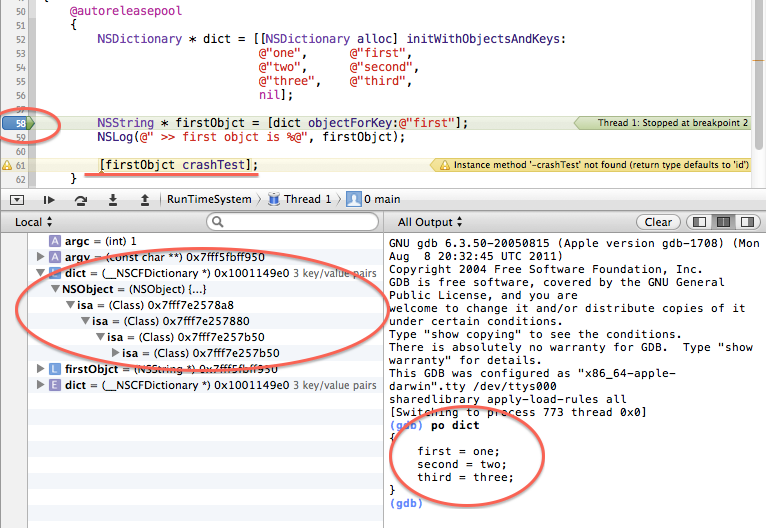
上圖中,我使用 po 命令顯示一個 NSDictionary 的內容。注意在左側我們可以看到 dict 的一些信息:3 key/value pairs,顯示該 dict 包含的數據量,而展開的信息顯示 isa 層次體系(即class 和 metaclass結構關系)。我們可以右擊左側的 dict,選中“Print Description of "dict"”,則可以在控制臺輸出 dict 的詳細信息:
Printing description of dict:
<CFBasicHash 0x1001149e0 [0x7fff7e27ff40]>{type = immutable dict, count = 3,
entries =>
0 : <CFString 0x100002458 [0x7fff7e27ff40]>{contents = "first"} = <CFString 0x100002438 [0x7fff7e27ff40]>{contents = "one"}
1 : <CFString 0x100002498 [0x7fff7e27ff40]>{contents = "second"} = <CFString 0x100002478 [0x7fff7e27ff40]>{contents = "two"}
2 : <CFString 0x1000024d8 [0x7fff7e27ff40]>{contents = "third"} = <CFString 0x1000024b8 [0x7fff7e27ff40]>{contents = "three"}
}
(gdb)
print 命令:有點類似于格式化輸出,可以輸出對象的不同信息:
如:
(gdb) print (char *)[[dict description] cStringUsingEncoding:4]
$1 = 0x100115620 "{\n first = one;\n second = two;\n third = three;\n}"
(gdb)
注:4是 NSUTF8StringEncoding 的值。
info 命令:我們可以查看內存地址所在信息
比如 "info symbol 內存地址" 可以獲取內存地址所在的 symbol 相關信息:
(gdb) info symbol 0x00000001000017f7 main + 343 in section LC_SEGMENT.__TEXT.__text of /Users/LuoZhaohui/Library/Developer/Xcode/DerivedData/RunTimeSystem-anzdlhiwvlbizpfureuvenvmatnp/Build/Products/Debug/RunTimeSystem
比如 "
info line *內存地址" 可以獲取內存地址所在的代碼行相關信息:
(gdb) info line *0x00000001000017f7 Line 62 of "/Users/LuoZhaohui/Documents/Study/RunTimeSystem/RunTimeSystem/main.m" starts at address 0x1000017f7 <main+343> and ends at 0x10000180a <main+362>.
show 命令:顯示 GDB 相關的信息。如:show version 顯示GDB版本信息
(gdb) show version
GNU gdb 6.3.50-20050815 (Apple version gdb-1708) (Mon Aug 8 20:32:45 UTC 2011)
Copyright 2004 Free Software Foundation, Inc.
GDB is free software, covered by the GNU General Public License, and you are
welcome to change it and/or distribute copies of it under certain conditions.
Type "show copying" to see the conditions.
There is absolutely no warranty for GDB. Type "show warranty" for details.
This GDB was configured as "x86_64-apple-darwin".
(gdb)
help 命令:如果忘記某條命令的語法了,可以使用 help 命令名 來獲取幫助信息。如:help info 顯示 info 命令的用法。
(gdb) help info
Generic command
for showing things about the program being debugged.
List of info subcommands:
info address -- Describe where symbol SYM
is stored
info all-registers -- List of all registers and their contents
info args -- Argument variables of current stack frame
info auxv -- Display the inferior's auxiliary vector
info breakpoints -- Status of user-settable breakpoints
info
catch -- Exceptions that can be caught
in the current stack frame
info checkpoints -- Help
info classes -- All Objective-C classes

info vector -- Print the status of the vector unit
info warranty -- Various kinds of warranty you
do not have
info watchpoints -- Synonym
for ``info breakpoints''
Type "help info" followed by info subcommand name
for full documentation.
Command name abbreviations are allowed
if unambiguous.
(gdb)
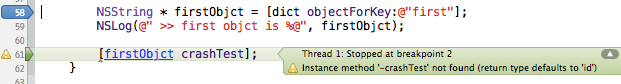
在系統拋出異常處設置斷點
有時候我們的程序不知道跑到哪個地方就 crash 了,而 crash 又很難重現。保守的做法是在系統拋出異常之前設置斷點,具體來說是在 objc_exception_throw處設置斷點。設置步驟為:首先在 XCode 按 CMD + 6,進入斷點管理窗口;然后點擊右下方的 +,增加新的 Symbolic Breakpoint,在 Symbol 一欄輸入:objc_exception_throw,然后點擊 done,完成。 這樣在 Debug 模式下,如果程序即將拋出異常,就能在拋出異常處中斷了。比如在前面的代碼中,我讓 [firstObjctcrashTest]; 拋出異常。在 objc_exception_throw 處設置斷點之后,程序就能在該代碼處中斷了,我們從而知道代碼在什么地方出問題了。