Visulalization Boost Voronoi in OpenSceneGraph
eryar@163.com
Abstract. One of the important features of the boost polygon library is the implementation of the generic sweepline algorithm to construct Voronoi diagrams of points and linear segments in 2D(developed as part of the Google Summer of Code 2010 program). Voronoi diagram data structure has applications in image segmentation, optical character recognition, nearest neighbor queries execution. It is closely related with the other computational geometry conectps: Delaunay triangulation, medial axis, straight skeleton, the largest empty circle. The paper focus on the usage of Boost.Polygon Voronoi Diagram and visualize it in OpenSceneGraph.
Key words. Voronoi, Boost.Polygon, C++, OpenSceneGraph, Visualization
1. Introduction
計(jì)算幾何(Computational Geometry)作為一門學(xué)科���,起源于20世紀(jì)70年代���,經(jīng)過(guò)近四十多年的發(fā)展�����,其研究?jī)?nèi)容不斷擴(kuò)大,涉及Voronoi圖�����、三角剖分���、凸包���、直線與多邊形求交�、可見(jiàn)性�����、路徑規(guī)劃�、多邊形剖分等內(nèi)容�����。據(jù)相關(guān)統(tǒng)計(jì)�����,在數(shù)以千計(jì)的相關(guān)文章中,約有15%是關(guān)于Voronoi圖及其對(duì)偶(dual)圖Delaunay三角剖分(Delaunay Triangulation)的研究�。由于Voronoi圖具有最近性、鄰接性等眾多性質(zhì)和比較系統(tǒng)的理論體系�,如今已經(jīng)在計(jì)算機(jī)圖形學(xué)、機(jī)械工程���、地理信息系統(tǒng)���、機(jī)器人���、圖像處理、大數(shù)據(jù)分析與處理�����、生物計(jì)算及無(wú)線傳感網(wǎng)絡(luò)等領(lǐng)域得到了廣泛應(yīng)用�����,同時(shí)也是解決碰撞檢測(cè)、路徑規(guī)劃�、可見(jiàn)性計(jì)算�、骨架計(jì)算以及凸包計(jì)算等計(jì)算幾何所涉及的其他問(wèn)題的有效工具���。
Voronoi圖的起源最早可以追溯到17世紀(jì)�����。1644年�,Descartes用類似Voronoi圖的結(jié)構(gòu)顯示太陽(yáng)系中物質(zhì)的分布�。數(shù)學(xué)家G.L. Dirichlet和M.G.Voronoi分別于1850年和1908年在他們的論文中討論了Voronoi圖的概念,所以Voronoi圖又叫Dirichlet tessellation�。在其他領(lǐng)域�,這個(gè)概念也曾獨(dú)立地出現(xiàn)���,如生物學(xué)和生理學(xué)中稱之為中軸變換(Medial Axis Transform)或骨架(Skeleton)�。化學(xué)與物理學(xué)中稱之為Wigner-Seitz Zones,氣象學(xué)與地理學(xué)中稱之為Thiessen多邊形�。Voronoi圖最早由Thiessen應(yīng)用于氣象觀測(cè)站中隨機(jī)分布的研究���。由于M.G. Voronoi從更通用的n維情況對(duì)其進(jìn)行研究和定義�,所以Voronoi圖這個(gè)名稱為大多數(shù)人所使用���。
在路徑規(guī)劃�、機(jī)械加工、模式識(shí)別、虛擬現(xiàn)實(shí)、生物計(jì)算等領(lǐng)域�,將站點(diǎn)從離散點(diǎn)擴(kuò)展到線段圓弧等生成Voronoi圖的方式也是非常常見(jiàn)的�。
目前可用于生成Voronoi圖的庫(kù)有一些���,很多是開(kāi)源庫(kù)�����。像CGAL庫(kù)、boost中也提供了生成Voronoi圖的算法。本文根據(jù)Boost.Polygon中的Voronoi庫(kù),并用OpenSceneGraph顯示出剖分結(jié)果�����。
2. Boost.Polygon Voronoi Diagram
Boost.Polygon庫(kù)提供了構(gòu)造Voronoi圖的接口���,可根據(jù)點(diǎn)集���、線段集來(lái)生成Voronoi圖�,如下圖所示:
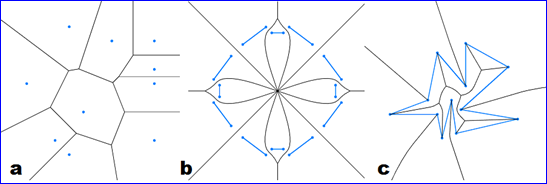
Figure 2.1 Voronoi Diagram generated by Boost.Polygon Voronoi Algorithms
Boost.Polygon中的基于掃描線算法(sweep-line algorithm)Voronoi庫(kù)可以實(shí)現(xiàn)如下功能:
v 輸入數(shù)據(jù)可以是點(diǎn)集和線段;
v 算法的穩(wěn)定性高及輸出完整的拓樸信息���;
v 可以控制輸出的幾何信息的精度;
計(jì)算幾何方面以穩(wěn)定性著稱的CGAL庫(kù)中的Voronoi算法只滿足前兩個(gè)功能�����。S-Hull庫(kù)以上功能都沒(méi)有很好的滿足���。下面是一些Boost.Polygon�,CGAL,S-Hull庫(kù)的對(duì)比數(shù)據(jù):

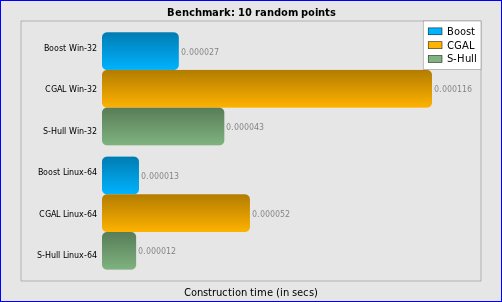
Figure 2.2 Construction time for 10 random points
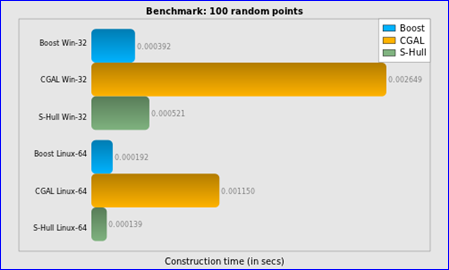
Figure 2.3 Construction time for 100 random points
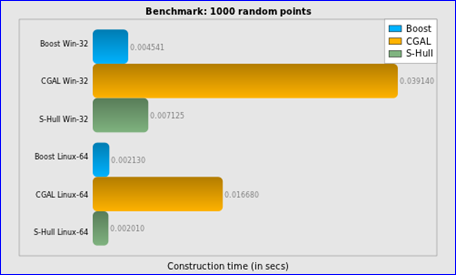
Figure 2.4 Construction time for 1000 random points
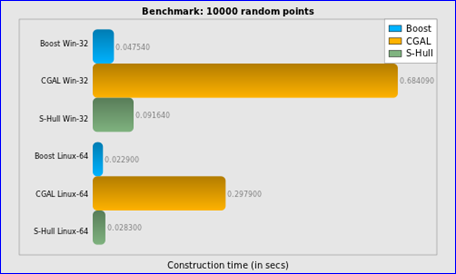
Figure 2.5 Construction time for 10000 random points
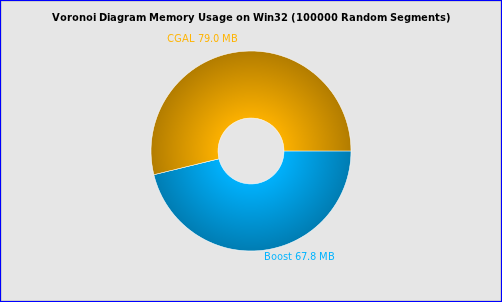
Figure 2.6 Memory usage for 100000 random points
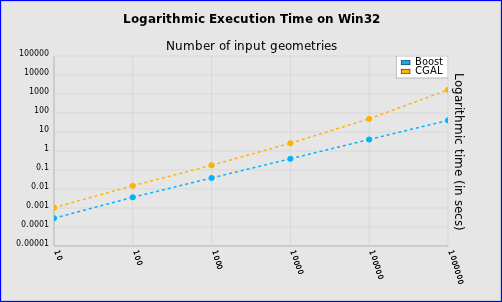
Figure 2.7 Logarithmic Execution Time
結(jié)論:
v 在輸入上沒(méi)有限制這點(diǎn)上CGAL要優(yōu)于Boost.Polygon�;
v Boost.Polygon Voronoi的穩(wěn)定性要高于S-Hull�����;
v Boost.Polygon Voronoi和S-Hull的時(shí)間復(fù)雜度為N*log(N),而CGAL的不是�����;
v Boost.Polygon Voronoi的輸出頂點(diǎn)的精度高于CGAL庫(kù)�;
v Boost.Polygon Voronoi的速度快�;
v Boost.Polygon Voronoi根據(jù)10000個(gè)點(diǎn)或1000個(gè)線段來(lái)構(gòu)造Voronoi的時(shí)間為0.02秒以內(nèi),所以可用來(lái)處理有實(shí)時(shí)性要求的場(chǎng)景���;
3. Implementation
Boost.Polygon的Voronoi算法使用簡(jiǎn)單�����,只需要輸入點(diǎn)集或線段集合,就可以直接構(gòu)造出Voronoi圖了�����。最簡(jiǎn)單的程序示例代碼如下:
/*
* Copyright (c) 2014 eryar All Rights Reserved.
*
* File : Main.cpp
* Author : eryar@163.com
* Date : 2014-05-06 18:28
* Version : V1.0
*
* Description : The Simplest example for boost voronoi library.
* Key words : boost voronoi, C++
*
*/
#include "boost/polygon/voronoi.hpp"
using namespace boost::polygon;
typedef int coordinate_type;
typedef point_data<coordinate_type> Point;
typedef voronoi_diagram<double> VD;
int main(int argc, char* argv[])
{
std::vector<Point> points;
points.push_back(Point(0, 0));
points.push_back(Point(1, 6));
points.push_back(Point(-4, 5));
points.push_back(Point(5, -1));
points.push_back(Point(3, -11));
points.push_back(Point(13, -1));
VD vd;
construct_voronoi(points.begin(), points.end(), &vd);
return 0;
}
且Boost.Polygon的Voronoi算法遍歷Voronoi邊Edges���,Voronoi單元cell�,Voronoi頂點(diǎn)Vertex也很直接。如下代碼所示為遍歷所有邊�����,來(lái)將剖分結(jié)果可視化:
/*
* Copyright (c) 2014 eryar All Rights Reserved.
*
* File : Main.cpp
* Author : eryar@163.com
* Date : 2014-05-06 18:28
* Version : V1.0
*
* Description : VoronoiViewer for boost voronoi library visulization.
* Key words : boost voronoi, C++, OpenSceneGraph
*
*/
#include <osgViewer/Viewer>
#include <osgGA/StateSetManipulator>
#include <osgViewer/ViewerEventHandlers>
#pragma comment(lib, "osgd.lib")
#pragma comment(lib, "osgDBd.lib")
#pragma comment(lib, "osgGAd.lib")
#pragma comment(lib, "osgViewerd.lib")
#include "boost/polygon/voronoi.hpp"
using namespace boost::polygon;
typedef double coordinate_type;
typedef point_data<coordinate_type> Point;
typedef voronoi_diagram<coordinate_type> VD;
osg::Node* BuildVoronoiDiagram(void)
{
srand(static_cast<unsigned int> (time(NULL)));
osg::ref_ptr<osg::Geode> theGeode = new osg::Geode();
osg::ref_ptr<osg::Geometry> theLines = new osg::Geometry();
osg::ref_ptr<osg::Vec3Array> theVertices = new osg::Vec3Array();
VD vd;
std::vector<Point> thePoints;
// Add points for the Voronoi Diagram.
for (int i = 0; i < 100; ++i)
{
int x = rand() % 100;
int y = rand() % 100;
thePoints.push_back(Point(x, y));
// Display the site of the Voronoi Diagram.
theVertices->push_back(osg::Vec3(x - 1, 0.0, y));
theVertices->push_back(osg::Vec3(x + 1, 0.0, y));
theVertices->push_back(osg::Vec3(x, 0.0, y - 1));
theVertices->push_back(osg::Vec3(x, 0.0, y + 1));
}
construct_voronoi(thePoints.begin(), thePoints.end(), &vd);
// Visualize the edge of the Voronoi Diagram.
// Traversing Voronoi edges using edge iterator.
for (VD::const_edge_iterator it = vd.edges().begin(); it != vd.edges().end(); ++it)
{
if (it->is_primary())
{
if (it->is_finite())
{
theVertices->push_back(osg::Vec3(it->vertex0()->x(), 0.0, it->vertex0()->y()));
theVertices->push_back(osg::Vec3(it->vertex1()->x(), 0.0, it->vertex1()->y()));
}
else
{
Point p1 = thePoints[it->cell()->source_index()];
Point p2 = thePoints[it->twin()->cell()->source_index()];
Point origin;
Point direction;
coordinate_type koef = 1.0;
origin.x((p1.x() + p2.x()) * 0.5);
origin.y((p1.y() + p2.y()) * 0.5);
direction.x(p1.y() - p2.y());
direction.y(p2.x() - p1.x());
if (it->vertex0() == NULL)
{
theVertices->push_back(osg::Vec3(
origin.x() - direction.x() * koef,
0.0,
origin.y() - direction.y() * koef));
}
else
{
theVertices->push_back(osg::Vec3(it->vertex0()->x(), 0.0, it->vertex0()->y()));
}
if (it->vertex1() == NULL)
{
theVertices->push_back(osg::Vec3(
origin.x() + direction.x() * koef,
0.0,
origin.y() + direction.y() * koef));
}
else
{
theVertices->push_back(osg::Vec3(it->vertex1()->x(), 0.0, it->vertex1()->y()));
}
}
}
}
theLines->setVertexArray(theVertices);
// Set the colors.
osg::ref_ptr<osg::Vec4Array> theColors = new osg::Vec4Array();
theColors->push_back(osg::Vec4(1.0f, 1.0f, 0.0f, 1.0f));
theLines->setColorArray(theColors);
theLines->setColorBinding(osg::Geometry::BIND_OVERALL);
// Set the normal.
osg::ref_ptr<osg::Vec3Array> theNormals = new osg::Vec3Array();
theNormals->push_back(osg::Vec3(0.0f, -1.0f, 0.0f));
theLines->setNormalArray(theNormals);
theLines->setNormalBinding(osg::Geometry::BIND_OVERALL);
theLines->addPrimitiveSet(new osg::DrawArrays(osg::PrimitiveSet::LINES, 0, theVertices->size()));
theGeode->addDrawable(theLines);
return theGeode.release();
}
int main(int argc, char *argv[])
{
osgViewer::Viewer theViewer;
theViewer.setSceneData(BuildVoronoiDiagram());
theViewer.addEventHandler(new osgGA::StateSetManipulator(theViewer.getCamera()->getOrCreateStateSet()));
theViewer.addEventHandler(new osgViewer::StatsHandler);
theViewer.addEventHandler(new osgViewer::WindowSizeHandler);
return theViewer.run();
}
繪制Voronoi的邊時(shí)�,當(dāng)邊是有限的finite時(shí),直接可以畫(huà)出直線�;當(dāng)邊是infinite時(shí)�,根據(jù)定義計(jì)算出了無(wú)界邊的方向�。顯示結(jié)果如下圖所示:
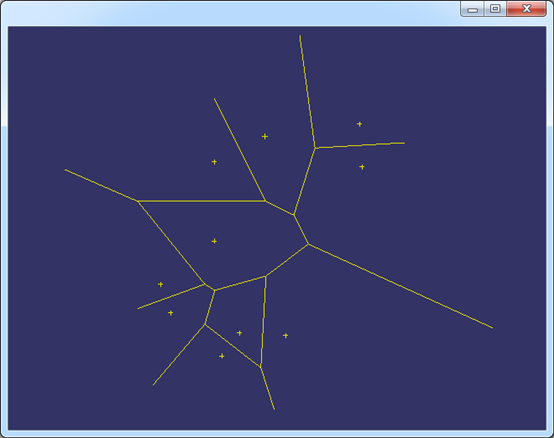
Figure 3.1 Construct Voronoi Diagram by 10 random points by Boost.Polygon
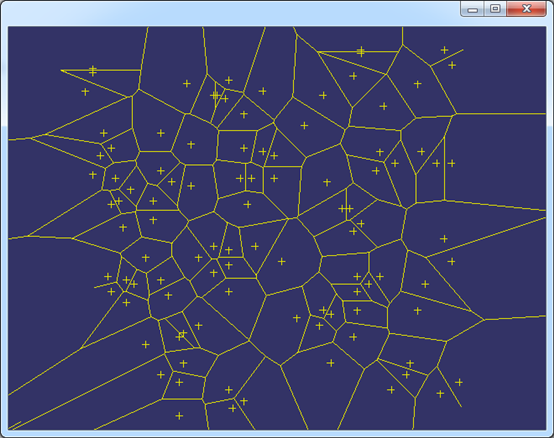
Figure 3.2 Construct Voronoi Diagram by 100 random points by Boost.Polygon
4. Conclusion
Boost.Polygon中的Voronoi圖算法穩(wěn)定性及性能較高,且可以根據(jù)站點(diǎn)查找相關(guān)的拓樸信息�,如根據(jù)站點(diǎn)查找Voronoi單元等�;惟一不足的就是默認(rèn)只處理整數(shù)點(diǎn)集�。
當(dāng)輸入有線段時(shí),生成的Voronoi圖中有曲線���,曲線的繪制可參考相關(guān)例子實(shí)現(xiàn)。
Boost.Polygon中的Voronoi算法都以模板實(shí)現(xiàn)���,編譯時(shí)只需要包含相關(guān)的頭文件即可,不依賴其他庫(kù)�����,使用還是很方便的�。
5. References
1. http://www.boost.org/
2. Boost.Polygon���,http://www.boost.org/doc/libs/1_55_0/libs/polygon/doc/index.htm
3. Voronoi Basic Tutorial�,\boost_1_54_0\libs\polygon\doc\voronoi_basic_tutorial.htm
4. 汪嘉業(yè), 王文平, 屠長(zhǎng)河, 楊承磊. 計(jì)算幾何及應(yīng)用. 科學(xué)出版社. 2011
5. 楊承磊, 呂琳, 楊義軍, 孟祥旭. Voronoi圖及其應(yīng)用. 清華大學(xué)出版社. 2013