一,matplotlib是什么
在python中用于數據庫可視化的2D繪圖庫。
二,安裝
http://matplotlib.org/users/installing.html
三,交互模式與非交互模式
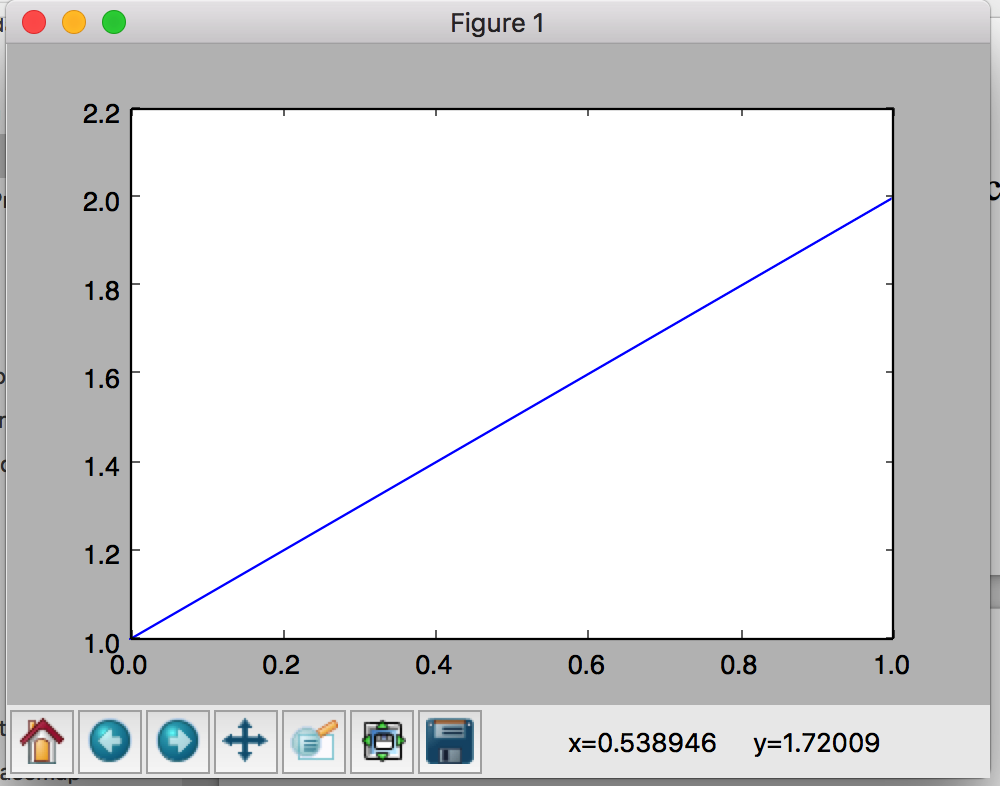
1,非交互模式
在python shell里面執行
import matplotlib.pyplot as plt
plt.plot([1, 2])
plt.show()
執行show之后會打開一個GUI窗口顯示,同時交互命令會阻塞。
2,交互模式
matplotlib.is_interactive()可以查看當前是否在交互模式;
matplotlib.pyplot.ion()用于打開交互模式;
matplotlib.pyplot.ioff()用于關閉交互模式;
import matplotlib.pyplot as plt
plt.ion()
plt.plot([1, 2])
執行plot之后打開了一個GUI窗口,交互命令沒有阻塞,繼續執行:
plt.plot([2, 3])
可以看到在窗口里面再畫了一條線。
也就是在非交互模式,需要一次畫好再調用show顯示;而交互模式在每次繪制后都能實時看到效果。
3,ipython的magic command
在ipython的%matplotlib也可以打開交互模式。
在交互模式中如果某些修改沒有自動刷新,可以調用matplotlib.pyplot.draw()刷新。
四,在jupyter notebook中使用matplotlib
1,%matplotlib
以交互模式打開獨立的GUI窗口,對同一個figure的繪制都自動刷新到對應的GUI窗口。
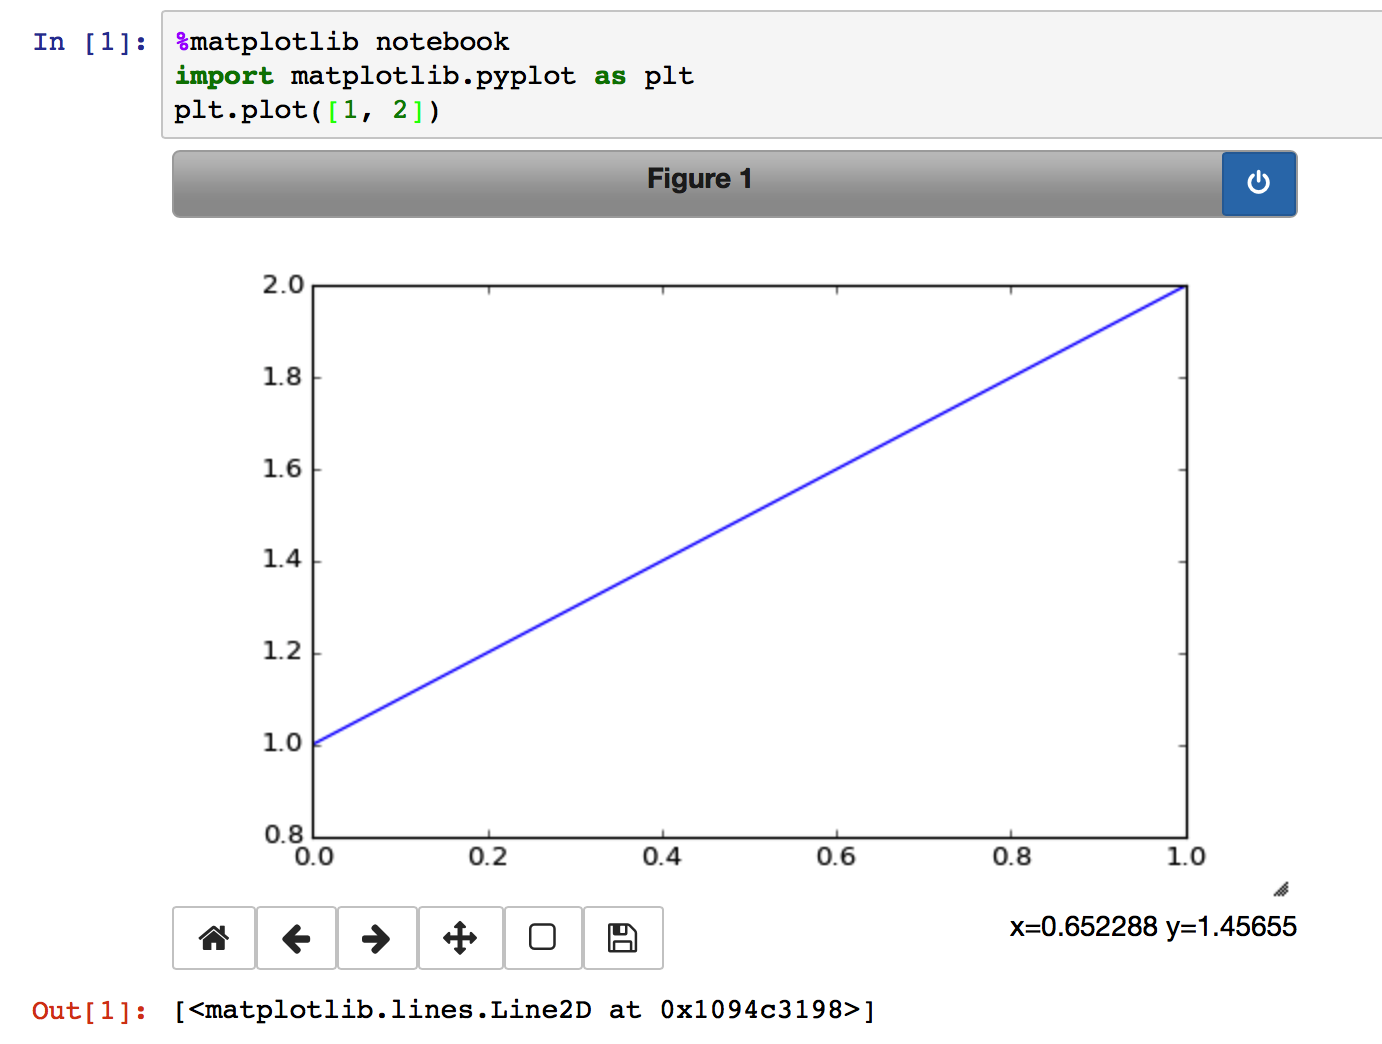
2,%matplotlib notebook
同%matplotlib,只是會將GUI窗口嵌入到cell的輸出。
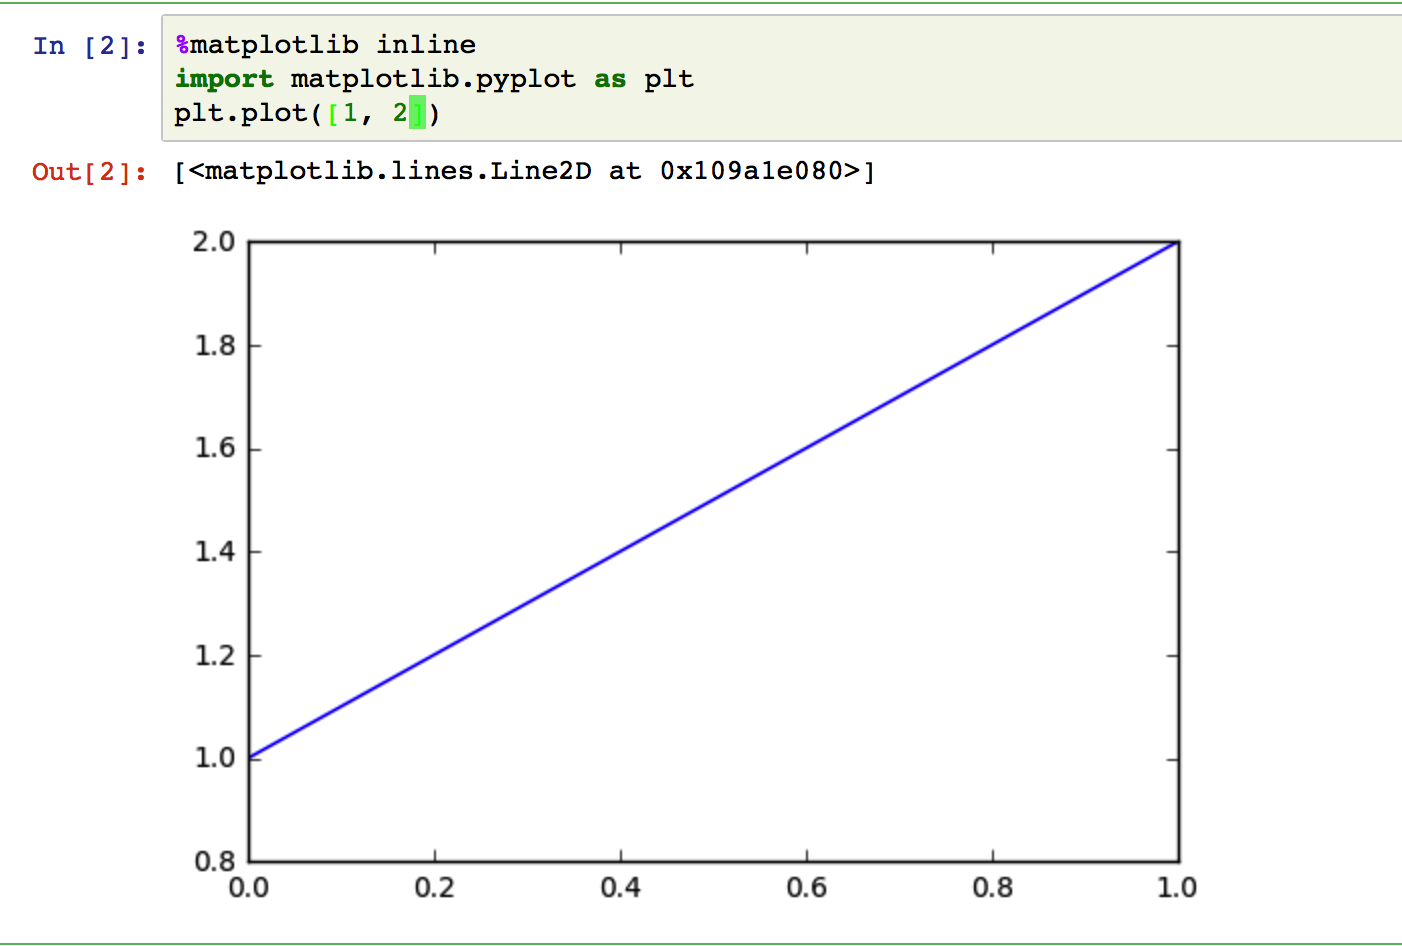
3,%matplotlib inline
將繪制的圖轉換為靜態圖片嵌入到cell的輸出。在不同的cell進行繪制效果不會疊加。
五,figure的各個組成部分
http://matplotlib.org/faq/usage_faq.html#parts-of-a-figure
六,matplotlib的兩種繪圖接口
1,matlab風格接口
所有的plt命令都會應用到自動創建的“當前”的figure和axes對象。使用plt.gcf和plt.gca獲取“當前”的figure和axes。
調用plt.plot([1, 2])即繪制到自動創建的figure和axes。
plt.plot([1, 2])
plt.plot([2, 1])
2,面向對象接口
顯式獲得繪制對象,在特定對象執行相應操作。
fig, ax = plt.subplots()
ax.plot([1, 2])
ax.plot([2, 1])
3,差別
對于簡單繪制兩種接口的差別不大,復雜情況面向對象接口會更合適。
另外plt的很多函數都可以直接轉為ax的函數,例如plt.plot() -> ax.plot(),但某些會有差別,例如plt.xlabel() -> ax.set_xlabel()。
七,各類圖形demo
http://matplotlib.org/gallery.html
八,API
http://matplotlib.org/api/index.html
參考:
1,http://matplotlib.org/index.html#
2,http://matplotlib.org/faq/usage_faq.html#what-is-interactive-mode
3,http://jupyter.org
4,http://www.labri.fr/perso/nrougier/teaching/matplotlib/#introduction
5,http://nbviewer.jupyter.org/github/jakevdp/PythonDataScienceHandbook/blob/master/notebooks/04.00-Introduction-To-Matplotlib.ipynb#Two-Interfaces-for-the-Price-of-One