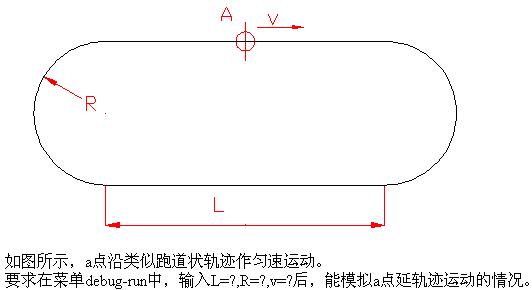
應同學之托第一次嘗試用matlab做動畫,弄了一下午加一晚上終于弱弱地搞定了。
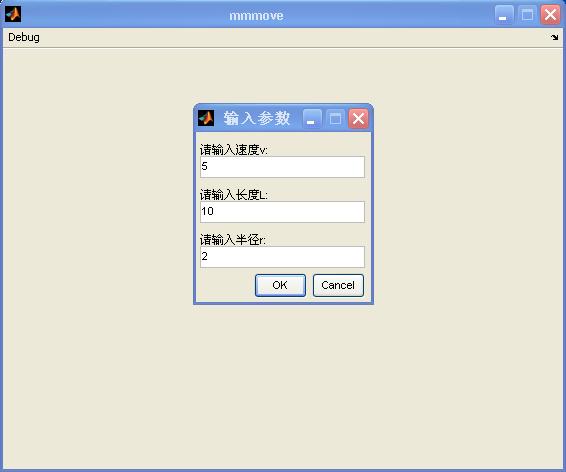
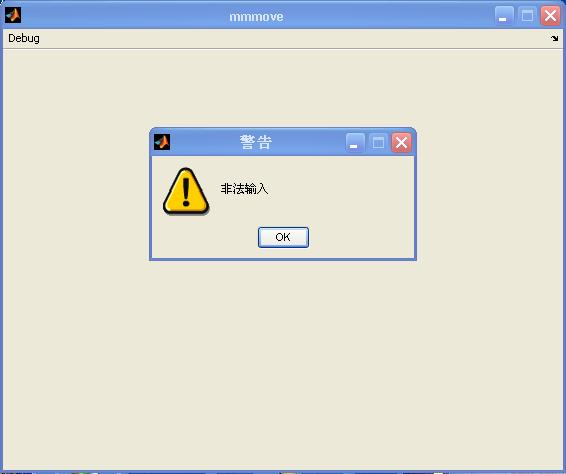
先做了個GUI界面,點擊Debug —run就會跳出個對話框,然后輸入參數,如果參數是負數的話就跳出警告窗口。如下圖:
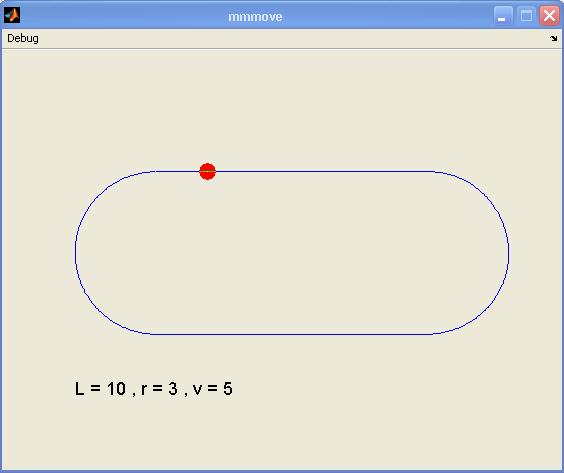
然后就開始動畫了:
下邊是源文件:
function varargout = mmmove(varargin)
% MMMOVE M-file for mmmove.fig
% MMMOVE, by itself, creates a new MMMOVE or raises the existing
% singleton*.
%
% H = MMMOVE returns the handle to a new MMMOVE or the handle to
% the existing singleton*.
%
% MMMOVE('CALLBACK',hObject,eventData,handles,...) calls the local
% function named CALLBACK in MMMOVE.M with the given input arguments.
%
% MMMOVE('Property','Value',...) creates a new MMMOVE or raises the
% existing singleton*. Starting from the left, property value pairs are
% applied to the GUI before mmmove_OpeningFunction gets called. An
% unrecognized property name or invalid value makes property application
% stop. All inputs are passed to mmmove_OpeningFcn via varargin.
%
% *See GUI Options on GUIDE's Tools menu. Choose "GUI allows only one
% instance to run (singleton)".
%
% See also: GUIDE, GUIDATA, GUIHANDLES
% Edit the above text to modify the response to help mmmove
% Last Modified by GUIDE v2.5 04-Apr-2008 21:41:08
% Begin initialization code - DO NOT EDIT
gui_Singleton = 1;
gui_State = struct('gui_Name', mfilename, ...
'gui_Singleton', gui_Singleton, ...
'gui_OpeningFcn', @mmmove_OpeningFcn, ...
'gui_OutputFcn', @mmmove_OutputFcn, ...
'gui_LayoutFcn', [] , ...
'gui_Callback', []);
if nargin && ischar(varargin{1})
gui_State.gui_Callback = str2func(varargin{1});
end
if nargout
[varargout{1:nargout}] = gui_mainfcn(gui_State, varargin{:});
else
gui_mainfcn(gui_State, varargin{:});
end
% End initialization code - DO NOT EDIT
% --- Executes just before mmmove is made visible.
function mmmove_OpeningFcn(hObject, eventdata, handles, varargin)
% This function has no output args, see OutputFcn.
% hObject handle to figure
% eventdata reserved - to be defined in a future version of MATLAB
% handles structure with handles and user data (see GUIDATA)
% varargin command line arguments to mmmove (see VARARGIN)
% Choose default command line output for mmmove
handles.output = hObject;
% Update handles structure
guidata(hObject, handles);
% UIWAIT makes mmmove wait for user response (see UIRESUME)
% uiwait(handles.figure1);
% --- Outputs from this function are returned to the command line.
function varargout = mmmove_OutputFcn(hObject, eventdata, handles)
% varargout cell array for returning output args (see VARARGOUT);
% hObject handle to figure
% eventdata reserved - to be defined in a future version of MATLAB
% handles structure with handles and user data (see GUIDATA)
% Get default command line output from handles structure
varargout{1} = handles.output;
% --------------------------------------------------------------------
function Debug_Callback(hObject, eventdata, handles)
% hObject handle to Debug (see GCBO)
% eventdata reserved - to be defined in a future version of MATLAB
% handles structure with handles and user data (see GUIDATA)
% --------------------------------------------------------------------
function run_Callback(h, eventdata, handles)
% hObject handle to run (see GCBO)
% eventdata reserved - to be defined in a future version of MATLAB
% handles structure with handles and user data (see GUIDATA)
prompt={'請輸入速度v:','請輸入長度L:','請輸入半徑r:'};
defans={'5','10','2'};
v=5;L=10;r=2;
p=inputdlg(prompt,'Input',1,defans);
v=str2double(p(1));
L=str2double(p(2));
r=str2double(p(3));
%guidata(h,handles)
if v<=0|L<=0|r<=0
warndlg('非法輸入','警告')
else
ox1=r;oy1=r;ox2=r+L;oy2=r;
x1=r:0.015*v:r+L;
y1=2*r*ones(size(x1));
thita=0:0.015*v/r:pi;
x2=sin(thita)*r+ox2;
y2=cos(thita)*r+oy2;
x3=r+L:-0.015*v:r;
y3=zeros(size(x3));
x4=-sin(thita)*r+ox1;
y4=-cos(thita)*r+oy1;
x=[x1 x2 x3 x4 x1(1)];
y=[y1 y2 y3 y4 y1(1)];
plot(x,y);
axis([0,2*r+L,-1,2*r+1]);
h_text=text(0,-2,['L = ' num2str(L) ' , ' 'r = ' num2str(r) ' , ' 'v = ' num2str(v)]);
set(h_text,'fontSize',13);
axis equal
set(gca,'Visible','off')
hm=line(r,2*r,'color','red','marker','.','markersize',37,'erasemode','xor');
while 1
for i=1:length(x)
set(hm,'xdata',x(i),'ydata',y(i));
pause(0.0003)
drawnow
end
end
end
為了能讓小球不停的循環運動,我加了while 1的語句。
這樣在關閉窗口的時候,matlab的命令窗里就會跳出一堆錯誤,大概是因為for循環里涉及到的hm隨著figure的關閉刪除了,但是程序仍然在運行,所以跳出東西說hm是invalid的。是不是可以放個停止程序的函數放figure或者axis的deleteFcn里頭,不過沒找到那樣的函數。
期待好心大牛指教。。。
還有就是速度控制問題,用計算的的速度控制,運行明顯偏慢,大概是程序自己運行也耗時吧,這個也不知道怎么辦。不過后來看到篇文章說用timer對象來產生動畫的,很不錯的樣子。
先引用下來:
(本文為Liuxqsmile原創,轉載請保留原文鏈接)
MATLAB中提供了一些動態顯示圖形的例子,例如vibes、truss等,但他們的程序結構都和由GUIDE產生的M文件的結構不同。truss中用while循環來更新圖形窗口,pause函數來控制更新的速度。這樣的結構是不適合放在某一個子函數中來執行的,否則程序在執行該子函數時無法響應用戶的其它操作,只能一開始就設置終止條件,等待動畫的自然結束。
MATLAB中的定時器timer可以定時觸發,周期性地執行指定的函數,我們可以據此來實現繪圖的自動更新,而不會影響整個GUI對用戶其它操作的響應。
比如我們要讓一個曲面隨時間周期性地變形,類似vibes中的情形,按下“開始”按鈕后,曲面開始周期振動,同時我們可以調整振幅大小、周期的長短。所不同的是我們一切都在子函數中完成。
在GUIDE中建立界面元素后,在“開始”按鈕的callback中建立一個定時器timer對象object
handles.timer = timer('Period',0.05,'ExecutionMode','FixedRate',
... 'TimerFcn',{@PlotUpdate,handles});
Period是觸發的周期,這里設置為0.05s,ExecutionMode是執行的方式,可以有三種選擇,對于不需要精確控制時序的動畫的影響不大,TimerFcn指定觸發時所執行函數的句柄,在這里我們建立一個函數PlotUpdate來執行繪圖命令,handles作為參數傳遞到PlotUpdate中去。
注意PlotUpdate的定義:
function PlotUpdate(obj,events,handles)
前兩個參數是必不可少的,最后的handles才是用戶傳遞的數據。在這個函數中你基本上可以無視前兩個參數,按照曲面的運動趨勢產生新的頂點坐標,然后用set命令將新的坐標賦給曲面(面片patch)對象的Vertices屬性。drawnow更新就可以了。你可以用曲面對象的UserData屬性存放當前振動的幅值相位等參數。
然后在“停止”按鈕的callback中stop(handles.timer)停止定時器,就可以停止自動繪圖了。
在“增大振幅”按鈕的callback中對振幅參數作修改。
排除了一些小問題后,你的曲面終于可以動起來了,按“增大振幅”等也沒有影響圖形的運動,真的是“一點影響都沒有”啊!
問題出在哪里呢?原來,當定時器第一次觸發時,用戶指定的參數被傳遞到響應函數中執行,以后每一次觸發,都是使用的這同一組參數,并不會隨著程序的運行而更新。好了,現在可以在
“增大振幅”中重新賦一次參數
set(handles.timer,'TimerFcn',{@PlotUpdate,handles});
怎么樣,達到你的要求了吧!想知道更多?MATLAB Help的index中輸入timer,夠多了吧。
動畫下載:下載后,用matlab7.0以上的版本可運行。